Intro
This blog post is based on an assignment from my Master’s of Environmental Data Science course EDS 223: Spatial Analysis for Environmental Data Science.
Load Libraries
#load libraries
import pandas as pd
import geopandas as gpd
import matplotlib.pyplot as plt
import os
import numpy as np
from shapely.geometry import Polygon
Dominica Outline
In the code chunk below, I define a file path for Dominica spatial data:
input_folder = r"data/dominica"
dominica_shapefile = "dma_admn_adm0_py_s1_dominode_v2.shp"

dominica_fp = os.path.join(input_folder, dominica_shapefile)
Next, I read in the Dominica shapefile using read_file():
dominica_data = gpd.read_file(dominica_fp)Then I change the CRS from WGS 84 to Dominica 1945 using the function to_crs(). This transforms the CRS to a more accurate geospatial reference system for the region of interest, coastal Dominica:
dominica_2002 = dominica_data.to_crs("EPSG:2002")Next, I plot the outline of Dominica to explore and check that the output is expected:
fig, ax = plt.subplots(figsize=(3, 3), dpi=200)
ax.grid(True)
ax.set_facecolor('lightblue')

dominica_2002.plot(ax = ax, color = 'green')
Whale Sighting Data
Next, I define the file path for whale sighting spatial data:
sightings_input_folder = r"data"
sightings_csv = "sightings2005_2018.csv"

sightings_fp = os.path.join(sightings_input_folder, sightings_csv)
Read file using read_file():
sightings_data = gpd.read_file(sightings_fp)Bootstrap the geometries:
sightings_points = gpd.points_from_xy(sightings_data['Long'], sightings_data['Lat'])Project the dataset into a Geo Data Frame with the appropriate CRS:
sightings_gdf_4326 = gpd.GeoDataFrame(sightings_data, geometry=sightings_points, crs = 'EPSG:4326')sightings_gdf_2002 = sightings_gdf_4326.to_crs("EPSG:2002")Create Grid
Define the grid’s boundaries:
minx, miny, maxx, maxy = sightings_gdf_2002.total_boundsDefine the grid’s cell size, in meters:
cell_size = 2000xs = np.arange(minx, maxx, cell_size)
ys = np.arange(miny, maxy, cell_size)def make_cell(x, y, cell_size):
ring = [
(x, y),
(x + cell_size, y),
(x + cell_size, y + cell_size),
(x, y + cell_size)
]
cell = Polygon(ring)
return cellcells = []
for x in xs:
for y in ys:
cell = make_cell(x, y, cell_size)
cells.append(cell)Create a grid GeoDataFrame, containing a cell for each row:
grid = gpd.GeoDataFrame({'geometry': cells}, crs=2002)Plot the grid to see how it looks:
We adjust the figure size so the cells are more visible than in the default grid:
grid.boundary.plot(figsize = (10,20))<AxesSubplot:>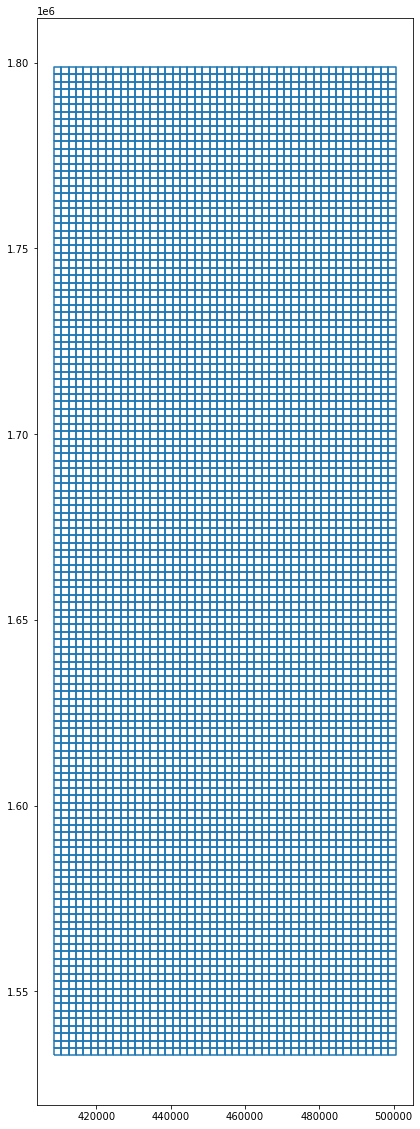
Extract Whale Habitat
Spatially join whale sightings data with grid data to get whale counts per grid cell:
sightings_with_grid = grid.sjoin(sightings_gdf_2002, how="inner")
sightings_with_grid| geometry | index_right | field_1 | GPStime | Lat | Long | |
|---|---|---|---|---|---|---|
| 124 | POLYGON ((408480.652 1780792.746, 410480.652 1… | 4327 | 4327 | 2018-03-15 06:41:03 | 16.127 | -61.896866 |
| 124 | POLYGON ((408480.652 1780792.746, 410480.652 1… | 4328 | 4328 | 2018-03-15 06:44:05 | 16.127666 | -61.900766 |
| 124 | POLYGON ((408480.652 1780792.746, 410480.652 1… | 4329 | 4329 | 2018-03-15 06:58:17 | 16.1305 | -61.903366 |
| 125 | POLYGON ((408480.652 1782792.746, 410480.652 1… | 4330 | 4330 | 2018-03-15 07:15:33 | 16.139583 | -61.900116 |
| 125 | POLYGON ((408480.652 1782792.746, 410480.652 1… | 4331 | 4331 | 2018-03-15 07:17:30 | 16.14175 | -61.897716 |
| … | … | … | … | … | … | … |
| 5133 | POLYGON ((484480.652 1690792.746, 486480.652 1… | 1147 | 1147 | 2008-05-04 16:59:36 | 15.304085 | -61.194134 |
| 5134 | POLYGON ((484480.652 1692792.746, 486480.652 1… | 1148 | 1148 | 2008-05-04 17:43:45 | 15.321439 | -61.19188 |
| 5985 | POLYGON ((498480.652 1532792.746, 500480.652 1… | 609 | 609 | 2005-03-20 11:50:05 | 13.86967067 | -61.0794355 |
| 5985 | POLYGON ((498480.652 1532792.746, 500480.652 1… | 611 | 611 | 2005-03-20 12:56:58 | 13.86967067 | -61.0794355 |
| 5985 | POLYGON ((498480.652 1532792.746, 500480.652 1… | 610 | 610 | 2005-03-20 12:05:10 | 13.86967067 | -61.0794355 |
4893 rows × 6 columns
Plot the Grid Cells with Whale Counts:
sightings_with_grid.plot(figsize = (10,20))<AxesSubplot:>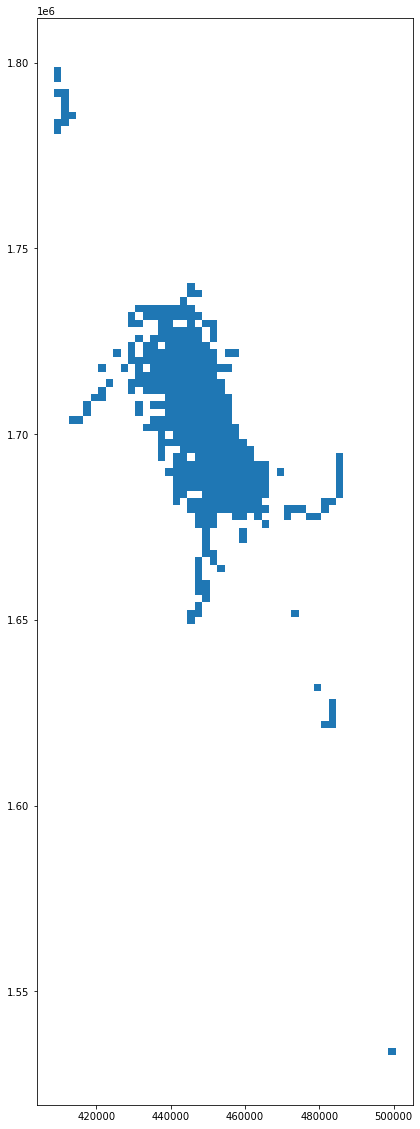
To ge the count of sightings in each cell, we have to perform a so called map-reduce operation using groupby and count. This is added to the Geo Data Frame as a new column:
grid['count'] = sightings_with_grid.groupby(sightings_with_grid.index).count()['index_right']
grid| geometry | count | |
|---|---|---|
| 0 | POLYGON ((408480.652 1532792.746, 410480.652 1… | NaN |
| 1 | POLYGON ((408480.652 1534792.746, 410480.652 1… | NaN |
| 2 | POLYGON ((408480.652 1536792.746, 410480.652 1… | NaN |
| 3 | POLYGON ((408480.652 1538792.746, 410480.652 1… | NaN |
| 4 | POLYGON ((408480.652 1540792.746, 410480.652 1… | NaN |
| … | … | … |
| 6113 | POLYGON ((498480.652 1788792.746, 500480.652 1… | NaN |
| 6114 | POLYGON ((498480.652 1790792.746, 500480.652 1… | NaN |
| 6115 | POLYGON ((498480.652 1792792.746, 500480.652 1… | NaN |
| 6116 | POLYGON ((498480.652 1794792.746, 500480.652 1… | NaN |
| 6117 | POLYGON ((498480.652 1796792.746, 500480.652 1… | NaN |
6118 rows × 2 columns
Subset grid df to cells with more than 20 sightings:
grid_20 = grid[grid['count'] > 20]grid_20_union = grid_20.unary_union
grid_20_union
Next we create a convex hull using the sightings we joined with unary_union to generate the “whale habitat”:
habitat_convex_hull = grid_20_union.convex_hull
habitat_convex_hull
Convert the habitat convex hull polygon to a Geo Data Frame:
convex_hull_gdf = gpd.GeoDataFrame(crs = 'EPSG:2002', geometry = [habitat_convex_hull])ax = convex_hull_gdf.plot(color = 'y')
dominica_2002.plot(ax = ax, figsize = (10,20))<AxesSubplot:>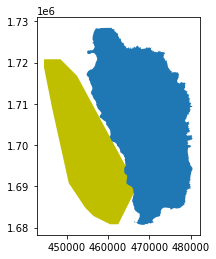
Vessel Data
Load Data
Define file path for AIS vessel data:
ais_input_folder = r"data"
ais_csv = "station1249.csv"

ais_fp = os.path.join(ais_input_folder, ais_csv)
Read file using read_file():
ais_data = gpd.read_file(ais_fp)Bootstrap the geometries:
ais_points = gpd.points_from_xy(ais_data['LON'], ais_data['LAT'])ais_gdf = gpd.GeoDataFrame(ais_data, geometry=ais_points, crs = 'EPSG:4326')Project to the Dominica 1945 CRS:
ais_gdf = ais_gdf.to_crs("EPSG:2002")The character strings in TIMESTAMP are not in a recognized datetime format. We parse those strings here:
pd.to_datetime(ais_gdf['TIMESTAMP'])0 2015-05-22 13:53:26
1 2015-05-22 13:52:57
2 2015-05-22 13:52:32
3 2015-05-22 13:52:24
4 2015-05-22 13:51:23
...
617257 2015-05-21 21:34:59
617258 2015-05-21 21:34:55
617259 2015-05-21 21:34:46
617260 2015-05-21 21:34:46
617261 2015-05-21 21:34:45
Name: TIMESTAMP, Length: 617262, dtype: datetime64[ns]Parse strings of the TIMESTAMP column to a recognized datetime format:
ais_gdf['TIMESTAMP'] = pd.to_datetime(ais_gdf['TIMESTAMP'])Calculate Distance and Speed
Spatially subset vessel data using whale habitat data:
habitat_ais_gdf = ais_gdf.sjoin(convex_hull_gdf, how = 'inner')Sort the dataframe by MMSI (Maritime Mobile Service Identity), the vessel’s unique identifier.
habitat_ais_sorted = habitat_ais_gdf.sort_values(['MMSI', 'TIMESTAMP'])Create a copy of our dataframe and shift each observation down one row using shift().
habitat_ais_copy = habitat_ais_sorted.copy()
habitat_ais_copy| field_1 | MMSI | LON | LAT | TIMESTAMP | geometry | index_right | |
|---|---|---|---|---|---|---|---|
| 235025 | 235025 | 203106200 | -61.40929 | 15.21021 | 2015-02-25 15:32:20 | POINT (462476.396 1680935.224) | 0 |
| 235018 | 235018 | 203106200 | -61.41107 | 15.21436 | 2015-02-25 15:34:50 | POINT (462283.995 1681393.698) | 0 |
| 235000 | 235000 | 203106200 | -61.41427 | 15.22638 | 2015-02-25 15:42:19 | POINT (461936.769 1682722.187) | 0 |
| 234989 | 234989 | 203106200 | -61.41553 | 15.2353 | 2015-02-25 15:47:19 | POINT (461798.818 1683708.377) | 0 |
| 234984 | 234984 | 203106200 | -61.41687 | 15.23792 | 2015-02-25 15:49:50 | POINT (461654.150 1683997.765) | 0 |
| … | … | … | … | … | … | … | … |
| 259103 | 259103 | 983191049 | -61.38322 | 15.2927 | 2015-02-19 19:50:45 | POINT (465250.372 1690066.434) | 0 |
| 259094 | 259094 | 983191049 | -61.38328 | 15.29259 | 2015-02-19 19:55:09 | POINT (465243.965 1690054.249) | 0 |
| 258954 | 258954 | 983191049 | -61.38344 | 15.2932 | 2015-02-19 20:51:12 | POINT (465226.597 1690121.667) | 0 |
| 258930 | 258930 | 983191049 | -61.38329 | 15.29258 | 2015-02-19 21:02:54 | POINT (465242.895 1690053.140) | 0 |
| 258206 | 258206 | 983191049 | -61.38301 | 15.29255 | 2015-02-20 01:11:35 | POINT (465272.964 1690049.908) | 0 |
167411 rows × 7 columns
Shift each observation down one row in our copied ship dataframe:
habitat_ais_copy = habitat_ais_copy.shift(periods = 1)
habitat_ais_copy| field_1 | MMSI | LON | LAT | TIMESTAMP | geometry | index_right | |
|---|---|---|---|---|---|---|---|
| 235025 | NaN | NaN | NaN | NaN | NaT | None | NaN |
| 235018 | 235025 | 203106200 | -61.40929 | 15.21021 | 2015-02-25 15:32:20 | POINT (462476.396 1680935.224) | 0.0 |
| 235000 | 235018 | 203106200 | -61.41107 | 15.21436 | 2015-02-25 15:34:50 | POINT (462283.995 1681393.698) | 0.0 |
| 234989 | 235000 | 203106200 | -61.41427 | 15.22638 | 2015-02-25 15:42:19 | POINT (461936.769 1682722.187) | 0.0 |
| 234984 | 234989 | 203106200 | -61.41553 | 15.2353 | 2015-02-25 15:47:19 | POINT (461798.818 1683708.377) | 0.0 |
| … | … | … | … | … | … | … | … |
| 259103 | 259118 | 983191049 | -61.38323 | 15.29282 | 2015-02-19 19:44:46 | POINT (465249.261 1690079.703) | 0.0 |
| 259094 | 259103 | 983191049 | -61.38322 | 15.2927 | 2015-02-19 19:50:45 | POINT (465250.372 1690066.434) | 0.0 |
| 258954 | 259094 | 983191049 | -61.38328 | 15.29259 | 2015-02-19 19:55:09 | POINT (465243.965 1690054.249) | 0.0 |
| 258930 | 258954 | 983191049 | -61.38344 | 15.2932 | 2015-02-19 20:51:12 | POINT (465226.597 1690121.667) | 0.0 |
| 258206 | 258930 | 983191049 | -61.38329 | 15.29258 | 2015-02-19 21:02:54 | POINT (465242.895 1690053.140) | 0.0 |
167411 rows × 7 columns
Join original dataframe with shifted copy using join():
ais_joined = habitat_ais_copy.join(habitat_ais_gdf, how = 'left', lsuffix = '_2', sort = False)
ais_joined| field_1_2 | MMSI_2 | LON_2 | LAT_2 | TIMESTAMP_2 | geometry_2 | index_right_2 | field_1 | MMSI | LON | LAT | TIMESTAMP | geometry | index_right | |
|---|---|---|---|---|---|---|---|---|---|---|---|---|---|---|
| 235025 | NaN | NaN | NaN | NaN | NaT | None | NaN | 235025 | 203106200 | -61.40929 | 15.21021 | 2015-02-25 15:32:20 | POINT (462476.396 1680935.224) | 0 |
| 235018 | 235025 | 203106200 | -61.40929 | 15.21021 | 2015-02-25 15:32:20 | POINT (462476.396 1680935.224) | 0.0 | 235018 | 203106200 | -61.41107 | 15.21436 | 2015-02-25 15:34:50 | POINT (462283.995 1681393.698) | 0 |
| 235000 | 235018 | 203106200 | -61.41107 | 15.21436 | 2015-02-25 15:34:50 | POINT (462283.995 1681393.698) | 0.0 | 235000 | 203106200 | -61.41427 | 15.22638 | 2015-02-25 15:42:19 | POINT (461936.769 1682722.187) | 0 |
| 234989 | 235000 | 203106200 | -61.41427 | 15.22638 | 2015-02-25 15:42:19 | POINT (461936.769 1682722.187) | 0.0 | 234989 | 203106200 | -61.41553 | 15.2353 | 2015-02-25 15:47:19 | POINT (461798.818 1683708.377) | 0 |
| 234984 | 234989 | 203106200 | -61.41553 | 15.2353 | 2015-02-25 15:47:19 | POINT (461798.818 1683708.377) | 0.0 | 234984 | 203106200 | -61.41687 | 15.23792 | 2015-02-25 15:49:50 | POINT (461654.150 1683997.765) | 0 |
| … | … | … | … | … | … | … | … | … | … | … | … | … | … | … |
| 259103 | 259118 | 983191049 | -61.38323 | 15.29282 | 2015-02-19 19:44:46 | POINT (465249.261 1690079.703) | 0.0 | 259103 | 983191049 | -61.38322 | 15.2927 | 2015-02-19 19:50:45 | POINT (465250.372 1690066.434) | 0 |
| 259094 | 259103 | 983191049 | -61.38322 | 15.2927 | 2015-02-19 19:50:45 | POINT (465250.372 1690066.434) | 0.0 | 259094 | 983191049 | -61.38328 | 15.29259 | 2015-02-19 19:55:09 | POINT (465243.965 1690054.249) | 0 |
| 258954 | 259094 | 983191049 | -61.38328 | 15.29259 | 2015-02-19 19:55:09 | POINT (465243.965 1690054.249) | 0.0 | 258954 | 983191049 | -61.38344 | 15.2932 | 2015-02-19 20:51:12 | POINT (465226.597 1690121.667) | 0 |
| 258930 | 258954 | 983191049 | -61.38344 | 15.2932 | 2015-02-19 20:51:12 | POINT (465226.597 1690121.667) | 0.0 | 258930 | 983191049 | -61.38329 | 15.29258 | 2015-02-19 21:02:54 | POINT (465242.895 1690053.140) | 0 |
| 258206 | 258930 | 983191049 | -61.38329 | 15.29258 | 2015-02-19 21:02:54 | POINT (465242.895 1690053.140) | 0.0 | 258206 | 983191049 | -61.38301 | 15.29255 | 2015-02-20 01:11:35 | POINT (465272.964 1690049.908) | 0 |
167411 rows × 14 columns
Next, we are looking to examine distances traveled by ships using their AIS data per row, so we eliminate rows in which MMSI for ship 1 and 2 are not the same to align the data:
ais_joined = ais_joined[ais_joined['MMSI_2'] == ais_joined['MMSI']]
ais_joined| field_1_2 | MMSI_2 | LON_2 | LAT_2 | TIMESTAMP_2 | geometry_2 | index_right_2 | field_1 | MMSI | LON | LAT | TIMESTAMP | geometry | index_right | |
|---|---|---|---|---|---|---|---|---|---|---|---|---|---|---|
| 235018 | 235025 | 203106200 | -61.40929 | 15.21021 | 2015-02-25 15:32:20 | POINT (462476.396 1680935.224) | 0.0 | 235018 | 203106200 | -61.41107 | 15.21436 | 2015-02-25 15:34:50 | POINT (462283.995 1681393.698) | 0 |
| 235000 | 235018 | 203106200 | -61.41107 | 15.21436 | 2015-02-25 15:34:50 | POINT (462283.995 1681393.698) | 0.0 | 235000 | 203106200 | -61.41427 | 15.22638 | 2015-02-25 15:42:19 | POINT (461936.769 1682722.187) | 0 |
| 234989 | 235000 | 203106200 | -61.41427 | 15.22638 | 2015-02-25 15:42:19 | POINT (461936.769 1682722.187) | 0.0 | 234989 | 203106200 | -61.41553 | 15.2353 | 2015-02-25 15:47:19 | POINT (461798.818 1683708.377) | 0 |
| 234984 | 234989 | 203106200 | -61.41553 | 15.2353 | 2015-02-25 15:47:19 | POINT (461798.818 1683708.377) | 0.0 | 234984 | 203106200 | -61.41687 | 15.23792 | 2015-02-25 15:49:50 | POINT (461654.150 1683997.765) | 0 |
| 234972 | 234984 | 203106200 | -61.41687 | 15.23792 | 2015-02-25 15:49:50 | POINT (461654.150 1683997.765) | 0.0 | 234972 | 203106200 | -61.41851 | 15.24147 | 2015-02-25 15:54:49 | POINT (461476.997 1684389.925) | 0 |
| … | … | … | … | … | … | … | … | … | … | … | … | … | … | … |
| 259103 | 259118 | 983191049 | -61.38323 | 15.29282 | 2015-02-19 19:44:46 | POINT (465249.261 1690079.703) | 0.0 | 259103 | 983191049 | -61.38322 | 15.2927 | 2015-02-19 19:50:45 | POINT (465250.372 1690066.434) | 0 |
| 259094 | 259103 | 983191049 | -61.38322 | 15.2927 | 2015-02-19 19:50:45 | POINT (465250.372 1690066.434) | 0.0 | 259094 | 983191049 | -61.38328 | 15.29259 | 2015-02-19 19:55:09 | POINT (465243.965 1690054.249) | 0 |
| 258954 | 259094 | 983191049 | -61.38328 | 15.29259 | 2015-02-19 19:55:09 | POINT (465243.965 1690054.249) | 0.0 | 258954 | 983191049 | -61.38344 | 15.2932 | 2015-02-19 20:51:12 | POINT (465226.597 1690121.667) | 0 |
| 258930 | 258954 | 983191049 | -61.38344 | 15.2932 | 2015-02-19 20:51:12 | POINT (465226.597 1690121.667) | 0.0 | 258930 | 983191049 | -61.38329 | 15.29258 | 2015-02-19 21:02:54 | POINT (465242.895 1690053.140) | 0 |
| 258206 | 258930 | 983191049 | -61.38329 | 15.29258 | 2015-02-19 21:02:54 | POINT (465242.895 1690053.140) | 0.0 | 258206 | 983191049 | -61.38301 | 15.29255 | 2015-02-20 01:11:35 | POINT (465272.964 1690049.908) | 0 |
166255 rows × 14 columns
Set the geometry for our joined data frame:
ais_joined = ais_joined.set_geometry(ais_joined['geometry'])Reproject to Dominica 1945 as our CRS:
ais_joined = ais_joined.to_crs("EPSG:2002")Add a column in which we calculate the distance traveled between the first and second geometry:
ais_joined['distance'] = ais_joined['geometry'].distance(ais_joined['geometry_2'])
ais_joined| field_1_2 | MMSI_2 | LON_2 | LAT_2 | TIMESTAMP_2 | geometry_2 | index_right_2 | field_1 | MMSI | LON | LAT | TIMESTAMP | geometry | index_right | distance | |
|---|---|---|---|---|---|---|---|---|---|---|---|---|---|---|---|
| 235018 | 235025 | 203106200 | -61.40929 | 15.21021 | 2015-02-25 15:32:20 | POINT (462476.396 1680935.224) | 0.0 | 235018 | 203106200 | -61.41107 | 15.21436 | 2015-02-25 15:34:50 | POINT (462283.995 1681393.698) | 0 | 497.209041 |
| 235000 | 235018 | 203106200 | -61.41107 | 15.21436 | 2015-02-25 15:34:50 | POINT (462283.995 1681393.698) | 0.0 | 235000 | 203106200 | -61.41427 | 15.22638 | 2015-02-25 15:42:19 | POINT (461936.769 1682722.187) | 0 | 1373.116137 |
| 234989 | 235000 | 203106200 | -61.41427 | 15.22638 | 2015-02-25 15:42:19 | POINT (461936.769 1682722.187) | 0.0 | 234989 | 203106200 | -61.41553 | 15.2353 | 2015-02-25 15:47:19 | POINT (461798.818 1683708.377) | 0 | 995.792381 |
| 234984 | 234989 | 203106200 | -61.41553 | 15.2353 | 2015-02-25 15:47:19 | POINT (461798.818 1683708.377) | 0.0 | 234984 | 203106200 | -61.41687 | 15.23792 | 2015-02-25 15:49:50 | POINT (461654.150 1683997.765) | 0 | 323.533223 |
| 234972 | 234984 | 203106200 | -61.41687 | 15.23792 | 2015-02-25 15:49:50 | POINT (461654.150 1683997.765) | 0.0 | 234972 | 203106200 | -61.41851 | 15.24147 | 2015-02-25 15:54:49 | POINT (461476.997 1684389.925) | 0 | 430.317090 |
| … | … | … | … | … | … | … | … | … | … | … | … | … | … | … | … |
| 259103 | 259118 | 983191049 | -61.38323 | 15.29282 | 2015-02-19 19:44:46 | POINT (465249.261 1690079.703) | 0.0 | 259103 | 983191049 | -61.38322 | 15.2927 | 2015-02-19 19:50:45 | POINT (465250.372 1690066.434) | 0 | 13.315561 |
| 259094 | 259103 | 983191049 | -61.38322 | 15.2927 | 2015-02-19 19:50:45 | POINT (465250.372 1690066.434) | 0.0 | 259094 | 983191049 | -61.38328 | 15.29259 | 2015-02-19 19:55:09 | POINT (465243.965 1690054.249) | 0 | 13.766128 |
| 258954 | 259094 | 983191049 | -61.38328 | 15.29259 | 2015-02-19 19:55:09 | POINT (465243.965 1690054.249) | 0.0 | 258954 | 983191049 | -61.38344 | 15.2932 | 2015-02-19 20:51:12 | POINT (465226.597 1690121.667) | 0 | 69.619301 |
| 258930 | 258954 | 983191049 | -61.38344 | 15.2932 | 2015-02-19 20:51:12 | POINT (465226.597 1690121.667) | 0.0 | 258930 | 983191049 | -61.38329 | 15.29258 | 2015-02-19 21:02:54 | POINT (465242.895 1690053.140) | 0 | 70.438502 |
| 258206 | 258930 | 983191049 | -61.38329 | 15.29258 | 2015-02-19 21:02:54 | POINT (465242.895 1690053.140) | 0.0 | 258206 | 983191049 | -61.38301 | 15.29255 | 2015-02-20 01:11:35 | POINT (465272.964 1690049.908) | 0 | 30.241849 |
166255 rows × 15 columns
Add a column in which we calculate the time passed as ships traveled between the first and second geometry:
ais_joined['time_passed'] = abs(ais_joined['TIMESTAMP'] - ais_joined['TIMESTAMP_2'])
ais_joined| field_1_2 | MMSI_2 | LON_2 | LAT_2 | TIMESTAMP_2 | geometry_2 | index_right_2 | field_1 | MMSI | LON | LAT | TIMESTAMP | geometry | index_right | distance | time_passed | |
|---|---|---|---|---|---|---|---|---|---|---|---|---|---|---|---|---|
| 235018 | 235025 | 203106200 | -61.40929 | 15.21021 | 2015-02-25 15:32:20 | POINT (462476.396 1680935.224) | 0.0 | 235018 | 203106200 | -61.41107 | 15.21436 | 2015-02-25 15:34:50 | POINT (462283.995 1681393.698) | 0 | 497.209041 | 0 days 00:02:30 |
| 235000 | 235018 | 203106200 | -61.41107 | 15.21436 | 2015-02-25 15:34:50 | POINT (462283.995 1681393.698) | 0.0 | 235000 | 203106200 | -61.41427 | 15.22638 | 2015-02-25 15:42:19 | POINT (461936.769 1682722.187) | 0 | 1373.116137 | 0 days 00:07:29 |
| 234989 | 235000 | 203106200 | -61.41427 | 15.22638 | 2015-02-25 15:42:19 | POINT (461936.769 1682722.187) | 0.0 | 234989 | 203106200 | -61.41553 | 15.2353 | 2015-02-25 15:47:19 | POINT (461798.818 1683708.377) | 0 | 995.792381 | 0 days 00:05:00 |
| 234984 | 234989 | 203106200 | -61.41553 | 15.2353 | 2015-02-25 15:47:19 | POINT (461798.818 1683708.377) | 0.0 | 234984 | 203106200 | -61.41687 | 15.23792 | 2015-02-25 15:49:50 | POINT (461654.150 1683997.765) | 0 | 323.533223 | 0 days 00:02:31 |
| 234972 | 234984 | 203106200 | -61.41687 | 15.23792 | 2015-02-25 15:49:50 | POINT (461654.150 1683997.765) | 0.0 | 234972 | 203106200 | -61.41851 | 15.24147 | 2015-02-25 15:54:49 | POINT (461476.997 1684389.925) | 0 | 430.317090 | 0 days 00:04:59 |
| … | … | … | … | … | … | … | … | … | … | … | … | … | … | … | … | … |
| 259103 | 259118 | 983191049 | -61.38323 | 15.29282 | 2015-02-19 19:44:46 | POINT (465249.261 1690079.703) | 0.0 | 259103 | 983191049 | -61.38322 | 15.2927 | 2015-02-19 19:50:45 | POINT (465250.372 1690066.434) | 0 | 13.315561 | 0 days 00:05:59 |
| 259094 | 259103 | 983191049 | -61.38322 | 15.2927 | 2015-02-19 19:50:45 | POINT (465250.372 1690066.434) | 0.0 | 259094 | 983191049 | -61.38328 | 15.29259 | 2015-02-19 19:55:09 | POINT (465243.965 1690054.249) | 0 | 13.766128 | 0 days 00:04:24 |
| 258954 | 259094 | 983191049 | -61.38328 | 15.29259 | 2015-02-19 19:55:09 | POINT (465243.965 1690054.249) | 0.0 | 258954 | 983191049 | -61.38344 | 15.2932 | 2015-02-19 20:51:12 | POINT (465226.597 1690121.667) | 0 | 69.619301 | 0 days 00:56:03 |
| 258930 | 258954 | 983191049 | -61.38344 | 15.2932 | 2015-02-19 20:51:12 | POINT (465226.597 1690121.667) | 0.0 | 258930 | 983191049 | -61.38329 | 15.29258 | 2015-02-19 21:02:54 | POINT (465242.895 1690053.140) | 0 | 70.438502 | 0 days 00:11:42 |
| 258206 | 258930 | 983191049 | -61.38329 | 15.29258 | 2015-02-19 21:02:54 | POINT (465242.895 1690053.140) | 0.0 | 258206 | 983191049 | -61.38301 | 15.29255 | 2015-02-20 01:11:35 | POINT (465272.964 1690049.908) | 0 | 30.241849 | 0 days 04:08:41 |
166255 rows × 16 columns
Next, we convert the time passed to seconds for the purpose of calculating speed using the commands time_delta and total_seconds:
ais_joined['time_seconds'] = pd.to_timedelta(ais_joined.time_passed, errors='coerce').dt.total_seconds()
ais_joined| field_1_2 | MMSI_2 | LON_2 | LAT_2 | TIMESTAMP_2 | geometry_2 | index_right_2 | field_1 | MMSI | LON | LAT | TIMESTAMP | geometry | index_right | distance | time_passed | time_seconds | |
|---|---|---|---|---|---|---|---|---|---|---|---|---|---|---|---|---|---|
| 235018 | 235025 | 203106200 | -61.40929 | 15.21021 | 2015-02-25 15:32:20 | POINT (462476.396 1680935.224) | 0.0 | 235018 | 203106200 | -61.41107 | 15.21436 | 2015-02-25 15:34:50 | POINT (462283.995 1681393.698) | 0 | 497.209041 | 0 days 00:02:30 | 150.0 |
| 235000 | 235018 | 203106200 | -61.41107 | 15.21436 | 2015-02-25 15:34:50 | POINT (462283.995 1681393.698) | 0.0 | 235000 | 203106200 | -61.41427 | 15.22638 | 2015-02-25 15:42:19 | POINT (461936.769 1682722.187) | 0 | 1373.116137 | 0 days 00:07:29 | 449.0 |
| 234989 | 235000 | 203106200 | -61.41427 | 15.22638 | 2015-02-25 15:42:19 | POINT (461936.769 1682722.187) | 0.0 | 234989 | 203106200 | -61.41553 | 15.2353 | 2015-02-25 15:47:19 | POINT (461798.818 1683708.377) | 0 | 995.792381 | 0 days 00:05:00 | 300.0 |
| 234984 | 234989 | 203106200 | -61.41553 | 15.2353 | 2015-02-25 15:47:19 | POINT (461798.818 1683708.377) | 0.0 | 234984 | 203106200 | -61.41687 | 15.23792 | 2015-02-25 15:49:50 | POINT (461654.150 1683997.765) | 0 | 323.533223 | 0 days 00:02:31 | 151.0 |
| 234972 | 234984 | 203106200 | -61.41687 | 15.23792 | 2015-02-25 15:49:50 | POINT (461654.150 1683997.765) | 0.0 | 234972 | 203106200 | -61.41851 | 15.24147 | 2015-02-25 15:54:49 | POINT (461476.997 1684389.925) | 0 | 430.317090 | 0 days 00:04:59 | 299.0 |
| … | … | … | … | … | … | … | … | … | … | … | … | … | … | … | … | … | … |
| 259103 | 259118 | 983191049 | -61.38323 | 15.29282 | 2015-02-19 19:44:46 | POINT (465249.261 1690079.703) | 0.0 | 259103 | 983191049 | -61.38322 | 15.2927 | 2015-02-19 19:50:45 | POINT (465250.372 1690066.434) | 0 | 13.315561 | 0 days 00:05:59 | 359.0 |
| 259094 | 259103 | 983191049 | -61.38322 | 15.2927 | 2015-02-19 19:50:45 | POINT (465250.372 1690066.434) | 0.0 | 259094 | 983191049 | -61.38328 | 15.29259 | 2015-02-19 19:55:09 | POINT (465243.965 1690054.249) | 0 | 13.766128 | 0 days 00:04:24 | 264.0 |
| 258954 | 259094 | 983191049 | -61.38328 | 15.29259 | 2015-02-19 19:55:09 | POINT (465243.965 1690054.249) | 0.0 | 258954 | 983191049 | -61.38344 | 15.2932 | 2015-02-19 20:51:12 | POINT (465226.597 1690121.667) | 0 | 69.619301 | 0 days 00:56:03 | 3363.0 |
| 258930 | 258954 | 983191049 | -61.38344 | 15.2932 | 2015-02-19 20:51:12 | POINT (465226.597 1690121.667) | 0.0 | 258930 | 983191049 | -61.38329 | 15.29258 | 2015-02-19 21:02:54 | POINT (465242.895 1690053.140) | 0 | 70.438502 | 0 days 00:11:42 | 702.0 |
| 258206 | 258930 | 983191049 | -61.38329 | 15.29258 | 2015-02-19 21:02:54 | POINT (465242.895 1690053.140) | 0.0 | 258206 | 983191049 | -61.38301 | 15.29255 | 2015-02-20 01:11:35 | POINT (465272.964 1690049.908) | 0 | 30.241849 | 0 days 04:08:41 | 14921.0 |
166255 rows × 17 columns
Then, we add a column for speed, which is calculated by dividing the distance travelled by the time in seconds:
ais_joined_2['avg_speed_mps'] = ais_joined_2['distance'] / ais_joined_2['time_seconds']
ais_joined_2| field_1_2 | MMSI_2 | LON_2 | LAT_2 | TIMESTAMP_2 | geometry_2 | field_1 | MMSI | LON | LAT | TIMESTAMP | geometry | distance | time_passed | time_seconds | avg_speed | time_for_10_knots | time_difference | avg_speed_mps | |
|---|---|---|---|---|---|---|---|---|---|---|---|---|---|---|---|---|---|---|---|
| 511094 | 132562 | 1184 | -61.30541 | 14.79982 | 2015-07-21 12:27:51 | POINT (473775.169 1635578.904) | 132559 | 1184 | -61.39245 | 14.90217 | 2015-07-21 12:30:31 | POINT (464378.762 1646871.313) | 14690.505921 | 0 days 00:02:40 | 160.0 | 91.815662 | 285.563057 | 125.563057 | 91.815662 |
| 511090 | 132559 | 1184 | -61.39245 | 14.90217 | 2015-07-21 12:30:31 | POINT (464378.762 1646871.313) | 132555 | 1184 | -61.48131 | 15.00648 | 2015-07-21 12:33:12 | POINT (454794.970 1658383.473) | 14979.281904 | 0 days 00:02:41 | 161.0 | 93.039018 | 291.176462 | 130.176462 | 93.039018 |
| 511087 | 132555 | 1184 | -61.48131 | 15.00648 | 2015-07-21 12:33:12 | POINT (454794.970 1658383.473) | 132552 | 1184 | -61.54865 | 15.08558 | 2015-07-21 12:35:12 | POINT (447538.279 1667115.779) | 11353.974711 | 0 days 00:02:00 | 120.0 | 94.616456 | 220.705519 | 100.705519 | 94.616456 |
| 511084 | 132552 | 1184 | -61.54865 | 15.08558 | 2015-07-21 12:35:12 | POINT (447538.279 1667115.779) | 132549 | 1184 | -61.61598 | 15.1644 | 2015-07-21 12:37:12 | POINT (440288.034 1675819.254) | 11327.688520 | 0 days 00:02:00 | 120.0 | 94.397404 | 220.194552 | 100.194552 | 94.397404 |
| 511082 | 132549 | 1184 | -61.61598 | 15.1644 | 2015-07-21 12:37:12 | POINT (440288.034 1675819.254) | 132547 | 1184 | -61.6842 | 15.2442 | 2015-07-21 12:39:12 | POINT (432947.398 1684633.140) | 11470.375572 | 0 days 00:02:00 | 120.0 | 95.586463 | 222.968190 | 102.968190 | 95.586463 |
| … | … | … | … | … | … | … | … | … | … | … | … | … | … | … | … | … | … | … | … |
| 258930 | 258954 | 983191049 | -61.38344 | 15.2932 | 2015-02-19 20:51:12 | POINT (465226.597 1690121.667) | 258930 | 983191049 | -61.38329 | 15.29258 | 2015-02-19 21:02:54 | POINT (465242.895 1690053.140) | 70.438502 | 0 days 00:11:42 | 702.0 | 0.100340 | 1.369227 | -700.630773 | 0.100340 |
| 258206 | 258930 | 983191049 | -61.38329 | 15.29258 | 2015-02-19 21:02:54 | POINT (465242.895 1690053.140) | 258206 | 983191049 | -61.38301 | 15.29255 | 2015-02-20 01:11:35 | POINT (465272.964 1690049.908) | 30.241849 | 0 days 04:08:41 | 14921.0 | 0.002027 | 0.587860 | -14920.412140 | 0.002027 |
| 148161 | 148164 | 999000000 | -61.33341 | 14.71754 | 2015-03-23 09:50:22 | POINT (470789.272 1626469.836) | 148161 | 999000000 | -61.329 | 14.71341 | 2015-03-23 09:52:12 | POINT (471265.334 1626014.478) | 658.775338 | 0 days 00:01:50 | 110.0 | 5.988867 | 12.805679 | -97.194321 | 5.988867 |
| 148155 | 148161 | 999000000 | -61.329 | 14.71341 | 2015-03-23 09:52:12 | POINT (471265.334 1626014.478) | 148155 | 999000000 | -61.32005 | 14.70516 | 2015-03-23 09:55:51 | POINT (472231.502 1625104.938) | 1326.930261 | 0 days 00:03:39 | 219.0 | 6.059042 | 25.793684 | -193.206316 | 6.059042 |
| 148152 | 148155 | 999000000 | -61.32005 | 14.70516 | 2015-03-23 09:55:51 | POINT (472231.502 1625104.938) | 148152 | 999000000 | -61.31433 | 14.6998 | 2015-03-23 09:58:12 | POINT (472849.053 1624514.001) | 854.737548 | 0 days 00:02:21 | 141.0 | 6.061968 | 16.614912 | -124.385088 | 6.061968 |
615312 rows × 19 columns
To calculate the time it would take each vessel to cover the distance they did if their speed were changed to 10 knots, we converted nautical miles to meters in order to find the time in seconds it would take each vessel to do this.
m_per_nm = 1852

ais_joined['time_for_10_knots'] = (ais_joined['distance'] * 60 * 60) / (m_per_nm * 10)
ais_joined | field_1_2 | MMSI_2 | LON_2 | LAT_2 | TIMESTAMP_2 | geometry_2 | index_right_2 | field_1 | MMSI | LON | LAT | TIMESTAMP | geometry | index_right | distance | time_passed | time_seconds | time_for_10_knots | time_difference | |
|---|---|---|---|---|---|---|---|---|---|---|---|---|---|---|---|---|---|---|---|
| 235018 | 235025 | 203106200 | -61.40929 | 15.21021 | 2015-02-25 15:32:20 | POINT (462476.396 1680935.224) | 0.0 | 235018 | 203106200 | -61.41107 | 15.21436 | 2015-02-25 15:34:50 | POINT (462283.995 1681393.698) | 0 | 497.209041 | 0 days 00:02:30 | 150.0 | 96.649706 | -140.334946 |
| 235000 | 235018 | 203106200 | -61.41107 | 15.21436 | 2015-02-25 15:34:50 | POINT (462283.995 1681393.698) | 0.0 | 235000 | 203106200 | -61.41427 | 15.22638 | 2015-02-25 15:42:19 | POINT (461936.769 1682722.187) | 0 | 1373.116137 | 0 days 00:07:29 | 449.0 | 266.912424 | -422.308527 |
| 234989 | 235000 | 203106200 | -61.41427 | 15.22638 | 2015-02-25 15:42:19 | POINT (461936.769 1682722.187) | 0.0 | 234989 | 203106200 | -61.41553 | 15.2353 | 2015-02-25 15:47:19 | POINT (461798.818 1683708.377) | 0 | 995.792381 | 0 days 00:05:00 | 300.0 | 193.566553 | -280.643177 |
| 234984 | 234989 | 203106200 | -61.41553 | 15.2353 | 2015-02-25 15:47:19 | POINT (461798.818 1683708.377) | 0.0 | 234984 | 203106200 | -61.41687 | 15.23792 | 2015-02-25 15:49:50 | POINT (461654.150 1683997.765) | 0 | 323.533223 | 0 days 00:02:31 | 151.0 | 62.889827 | -144.710963 |
| 234972 | 234984 | 203106200 | -61.41687 | 15.23792 | 2015-02-25 15:49:50 | POINT (461654.150 1683997.765) | 0.0 | 234972 | 203106200 | -61.41851 | 15.24147 | 2015-02-25 15:54:49 | POINT (461476.997 1684389.925) | 0 | 430.317090 | 0 days 00:04:59 | 299.0 | 83.646951 | -290.635233 |
| … | … | … | … | … | … | … | … | … | … | … | … | … | … | … | … | … | … | … | … |
| 259103 | 259118 | 983191049 | -61.38323 | 15.29282 | 2015-02-19 19:44:46 | POINT (465249.261 1690079.703) | 0.0 | 259103 | 983191049 | -61.38322 | 15.2927 | 2015-02-19 19:50:45 | POINT (465250.372 1690066.434) | 0 | 13.315561 | 0 days 00:05:59 | 359.0 | 2.588338 | -358.741164 |
| 259094 | 259103 | 983191049 | -61.38322 | 15.2927 | 2015-02-19 19:50:45 | POINT (465250.372 1690066.434) | 0.0 | 259094 | 983191049 | -61.38328 | 15.29259 | 2015-02-19 19:55:09 | POINT (465243.965 1690054.249) | 0 | 13.766128 | 0 days 00:04:24 | 264.0 | 2.675921 | -263.732406 |
| 258954 | 259094 | 983191049 | -61.38328 | 15.29259 | 2015-02-19 19:55:09 | POINT (465243.965 1690054.249) | 0.0 | 258954 | 983191049 | -61.38344 | 15.2932 | 2015-02-19 20:51:12 | POINT (465226.597 1690121.667) | 0 | 69.619301 | 0 days 00:56:03 | 3363.0 | 13.532909 | -3361.646697 |
| 258930 | 258954 | 983191049 | -61.38344 | 15.2932 | 2015-02-19 20:51:12 | POINT (465226.597 1690121.667) | 0.0 | 258930 | 983191049 | -61.38329 | 15.29258 | 2015-02-19 21:02:54 | POINT (465242.895 1690053.140) | 0 | 70.438502 | 0 days 00:11:42 | 702.0 | 13.692149 | -700.630773 |
| 258206 | 258930 | 983191049 | -61.38329 | 15.29258 | 2015-02-19 21:02:54 | POINT (465242.895 1690053.140) | 0.0 | 258206 | 983191049 | -61.38301 | 15.29255 | 2015-02-20 01:11:35 | POINT (465272.964 1690049.908) | 0 | 30.241849 | 0 days 04:08:41 | 14921.0 | 5.878545 | -14920.412140 |
166255 rows × 19 columns
To find the difference between the time that it actually took and how much it would have taken at 10 knots, we subtracted the time it actually took from the time it would have taken the vessels under 10 knots.
ais_joined['time_difference'] = ais_joined['time_for_10_knots'] - ais_joined['time_seconds']
ais_joined| field_1_2 | MMSI_2 | LON_2 | LAT_2 | TIMESTAMP_2 | geometry_2 | index_right_2 | field_1 | MMSI | LON | LAT | TIMESTAMP | geometry | index_right | distance | time_passed | time_seconds | time_for_10_knots | time_difference | |
|---|---|---|---|---|---|---|---|---|---|---|---|---|---|---|---|---|---|---|---|
| 235018 | 235025 | 203106200 | -61.40929 | 15.21021 | 2015-02-25 15:32:20 | POINT (462476.396 1680935.224) | 0.0 | 235018 | 203106200 | -61.41107 | 15.21436 | 2015-02-25 15:34:50 | POINT (462283.995 1681393.698) | 0 | 497.209041 | 0 days 00:02:30 | 150.0 | 96.649706 | -53.350294 |
| 235000 | 235018 | 203106200 | -61.41107 | 15.21436 | 2015-02-25 15:34:50 | POINT (462283.995 1681393.698) | 0.0 | 235000 | 203106200 | -61.41427 | 15.22638 | 2015-02-25 15:42:19 | POINT (461936.769 1682722.187) | 0 | 1373.116137 | 0 days 00:07:29 | 449.0 | 266.912424 | -182.087576 |
| 234989 | 235000 | 203106200 | -61.41427 | 15.22638 | 2015-02-25 15:42:19 | POINT (461936.769 1682722.187) | 0.0 | 234989 | 203106200 | -61.41553 | 15.2353 | 2015-02-25 15:47:19 | POINT (461798.818 1683708.377) | 0 | 995.792381 | 0 days 00:05:00 | 300.0 | 193.566553 | -106.433447 |
| 234984 | 234989 | 203106200 | -61.41553 | 15.2353 | 2015-02-25 15:47:19 | POINT (461798.818 1683708.377) | 0.0 | 234984 | 203106200 | -61.41687 | 15.23792 | 2015-02-25 15:49:50 | POINT (461654.150 1683997.765) | 0 | 323.533223 | 0 days 00:02:31 | 151.0 | 62.889827 | -88.110173 |
| 234972 | 234984 | 203106200 | -61.41687 | 15.23792 | 2015-02-25 15:49:50 | POINT (461654.150 1683997.765) | 0.0 | 234972 | 203106200 | -61.41851 | 15.24147 | 2015-02-25 15:54:49 | POINT (461476.997 1684389.925) | 0 | 430.317090 | 0 days 00:04:59 | 299.0 | 83.646951 | -215.353049 |
| … | … | … | … | … | … | … | … | … | … | … | … | … | … | … | … | … | … | … | … |
| 259103 | 259118 | 983191049 | -61.38323 | 15.29282 | 2015-02-19 19:44:46 | POINT (465249.261 1690079.703) | 0.0 | 259103 | 983191049 | -61.38322 | 15.2927 | 2015-02-19 19:50:45 | POINT (465250.372 1690066.434) | 0 | 13.315561 | 0 days 00:05:59 | 359.0 | 2.588338 | -356.411662 |
| 259094 | 259103 | 983191049 | -61.38322 | 15.2927 | 2015-02-19 19:50:45 | POINT (465250.372 1690066.434) | 0.0 | 259094 | 983191049 | -61.38328 | 15.29259 | 2015-02-19 19:55:09 | POINT (465243.965 1690054.249) | 0 | 13.766128 | 0 days 00:04:24 | 264.0 | 2.675921 | -261.324079 |
| 258954 | 259094 | 983191049 | -61.38328 | 15.29259 | 2015-02-19 19:55:09 | POINT (465243.965 1690054.249) | 0.0 | 258954 | 983191049 | -61.38344 | 15.2932 | 2015-02-19 20:51:12 | POINT (465226.597 1690121.667) | 0 | 69.619301 | 0 days 00:56:03 | 3363.0 | 13.532909 | -3349.467091 |
| 258930 | 258954 | 983191049 | -61.38344 | 15.2932 | 2015-02-19 20:51:12 | POINT (465226.597 1690121.667) | 0.0 | 258930 | 983191049 | -61.38329 | 15.29258 | 2015-02-19 21:02:54 | POINT (465242.895 1690053.140) | 0 | 70.438502 | 0 days 00:11:42 | 702.0 | 13.692149 | -688.307851 |
| 258206 | 258930 | 983191049 | -61.38329 | 15.29258 | 2015-02-19 21:02:54 | POINT (465242.895 1690053.140) | 0.0 | 258206 | 983191049 | -61.38301 | 15.29255 | 2015-02-20 01:11:35 | POINT (465272.964 1690049.908) | 0 | 30.241849 | 0 days 04:08:41 | 14921.0 | 5.878545 | -14915.121455 |
166255 rows × 19 columns
Next, we took all measurements in the time_difference column > 0 to give us the vessels that actually travelled and therefor had positive time values.
fast_ships = ais_joined[ais_joined['time_difference'] > 0]
fast_ships| field_1_2 | MMSI_2 | LON_2 | LAT_2 | TIMESTAMP_2 | geometry_2 | index_right_2 | field_1 | MMSI | LON | LAT | TIMESTAMP | geometry | index_right | distance | time_passed | time_seconds | time_for_10_knots | time_difference | |
|---|---|---|---|---|---|---|---|---|---|---|---|---|---|---|---|---|---|---|---|
| 53218 | 53227 | 203106200 | -61.42602 | 15.35828 | 2015-04-26 16:04:15 | POINT (460636.434 1697307.052) | 0.0 | 53218 | 203106200 | -61.41927 | 15.34898 | 2015-04-26 16:08:16 | POINT (461363.603 1696280.393) | 0 | 1258.095562 | 0 days 00:04:01 | 241.0 | 244.554213 | 3.554213 |
| 84957 | 84977 | 203518400 | -61.51328 | 15.39394 | 2015-04-14 17:28:32 | POINT (451262.879 1701228.097) | 0.0 | 84957 | 203518400 | -61.51546 | 15.41408 | 2015-04-14 17:35:26 | POINT (451023.962 1703455.061) | 0 | 2239.743578 | 0 days 00:06:54 | 414.0 | 435.371322 | 21.371322 |
| 39279 | 39284 | 205531510 | -61.40996 | 15.34549 | 2015-05-02 18:24:17 | POINT (462363.849 1695897.095) | 0.0 | 39279 | 205531510 | -61.40981 | 15.3516 | 2015-05-02 18:26:15 | POINT (462378.106 1696572.914) | 0 | 675.968930 | 0 days 00:01:58 | 118.0 | 131.397848 | 13.397848 |
| 139303 | 139308 | 205571000 | -61.51243 | 15.33665 | 2015-03-26 09:35:06 | POINT (451368.368 1694892.030) | 0.0 | 139303 | 205571000 | -61.50684 | 15.33412 | 2015-03-26 09:37:06 | POINT (451968.978 1694613.570) | 0 | 662.020878 | 0 days 00:02:00 | 120.0 | 128.686564 | 8.686564 |
| 139301 | 139303 | 205571000 | -61.50684 | 15.33412 | 2015-03-26 09:37:06 | POINT (451968.978 1694613.570) | 0.0 | 139301 | 205571000 | -61.50115 | 15.33156 | 2015-03-26 09:39:06 | POINT (452580.343 1694331.833) | 0 | 673.159437 | 0 days 00:02:00 | 120.0 | 130.851726 | 10.851726 |
| … | … | … | … | … | … | … | … | … | … | … | … | … | … | … | … | … | … | … | … |
| 450065 | 71532 | 775907000 | -61.41703 | 15.26152 | 2015-08-31 15:22:58 | POINT (461629.985 1686607.886) | 0.0 | 71530 | 775907000 | -61.41251 | 15.26938 | 2015-08-31 15:25:58 | POINT (462112.948 1687478.511) | 0 | 995.610920 | 0 days 00:03:00 | 180.0 | 193.531280 | 13.531280 |
| 450061 | 71530 | 775907000 | -61.41251 | 15.26938 | 2015-08-31 15:25:58 | POINT (462112.948 1687478.511) | 0.0 | 71526 | 775907000 | -61.40833 | 15.27759 | 2015-08-31 15:28:58 | POINT (462559.266 1688387.759) | 0 | 1012.882607 | 0 days 00:03:00 | 180.0 | 196.888628 | 16.888628 |
| 450059 | 71526 | 775907000 | -61.40833 | 15.27759 | 2015-08-31 15:28:58 | POINT (462559.266 1688387.759) | 0.0 | 71524 | 775907000 | -61.40408 | 15.28582 | 2015-08-31 15:31:59 | POINT (463013.057 1689299.250) | 0 | 1018.205189 | 0 days 00:03:01 | 181.0 | 197.923255 | 16.923255 |
| 450056 | 71524 | 775907000 | -61.40408 | 15.28582 | 2015-08-31 15:31:59 | POINT (463013.057 1689299.250) | 0.0 | 71521 | 775907000 | -61.39967 | 15.29361 | 2015-08-31 15:34:59 | POINT (463484.122 1690162.135) | 0 | 983.093306 | 0 days 00:03:00 | 180.0 | 191.098051 | 11.098051 |
| 172907 | 172921 | 982358863 | -61.40942 | 15.35087 | 2015-03-14 16:04:52 | POINT (462420.182 1696492.289) | 0.0 | 172907 | 982358863 | -61.40751 | 15.34122 | 2015-03-14 16:08:23 | POINT (462628.091 1695425.545) | 0 | 1086.815697 | 0 days 00:03:31 | 211.0 | 211.260071 | 0.260071 |
21246 rows × 19 columns
Finally, we summed up all of the time differences which represents our approximation to the impact on shipping (in terms of increased travel time) of a 10-knot reduced-speed zone in our identified whale habitat.
seconds_lost = fast_ships['time_difference'].sum()days_lost = seconds_lost / (60 * 60 * 24)
days_lost27.876040448213132We can see from our calculations that a 10-knot reduced-speed zone would amount to a total of 27.89 day impact on shipping. While this number is may seem large, it is simply the total amount of time this reduction would cause across all vessels. In order to advocate for this regulation, it might be best to took at the additional time added to each invidudal vessel which we would expect be much lower overall.