This statistical analysis was completed for my Master’s program course, Environmental Data Science 222: Statistics for Environmental Data Science. To access the complete history of the code or submit comments of feedback as Issues, visit my project repository on Github. The code is not included in the PDF documentation of the project write-up, but is visible at this link to the live project web page.
My Question:
My analysis seeks to explore the questions: Are there seasonal differences in how U.S. school food programs feed students? What about long-term trends, and how did any trends change in 2020 during school closures from the Covid-19 pandemic?
I have previous experience working in school food systems to expand access to this resource for school communities, but you need no time in cafeterias to guess that there would be seasonality in feeding kids. Students off for summer means fewer students participating in school lunch in July and August. I was more interested in understanding seasonal differences within the school year: for example, does the US feed more students in fall compared to winter?
I am also interested in the impact of Covid-19 on school lunch participation. Across the U.S., many school nutrition programs adjusted to serving grab-and-go meals for students who rely on school for part of their daily nutrition during school closures. Understanding service gaps during this time will help our understanding of how effective or ineffective efforts to continue service were in feeding kids. Such knowledge can inform data-driven interventions for a future emergency school closure.
Background
The National School Lunch Program (NSLP) is an enormous food system with major implications for equity in American K-12 education. Every day, NSLP provides ~30 million children school lunch at free or reduced prices (1). It operates in public and nonprofit private schools and residential childcare facilities (2).
To provide meals at free and reduced cost to students, participating school districts are reimbursed subsidies for every qualifying meal they serve. To qualify for subsidy, meals served by Nutrition Services operators must meet federal meal pattern policies which define meal content.
In the US, an estimated 11.7 million children are estimated to live in food insecure homes this year (5). Students who experience hunger are reported to experience higher risk of decreased academic performance, more tardy and absent days, and more mental health challenges (4). A robust understanding of school food systems can create data-informed decisions around USDA and state school food policy and on-the-ground management so that students do not have hunger as an additional barrier to their wellbeing and academic achievement.
Data Description
The Food and Nutrition Services sector of the USDA offers monthly and annual reports of national participation in the NSLP and other school meal programs subsidized by the USDA (breakfast, seamless summer, supper, and snacks).
To answer my questions, I used the National Level Monthly Data for the National School Lunch Program, which gives national-level monthly participation in USDA school nutrition programs since October 2017 (47 months). This data comes in publicly available .pdf and .xlsx formats. I downloaded the .xlsx format of the monthly data and did some tidying in Excel to make sure the .csv version would be friendly with R. This version of the data can be found in my Github repository’s data folder.
Even after this manipulation in excel, there were changes to be made for easier manipulation of the monthly lunch data. All tidying and analysis uses R, which I use to give columns more descriptive names, remove odd columns that were added to the dataframe when I read in the .csv, mutate columns to exclude “%” “-” or spaces that R cannot make sense of.
#change first column name
colnames(usda_monthly)[1] <- "month"

#delete the weird columns that got added between downloading the raw data to my
#local computer and reading it to .Rmd
usda_monthly <- select(usda_monthly, -c("X", "X.1"))

#change last column name
colnames(usda_monthly)[9] <- "fiscal_year"
#remove percent signs from percent_free_of_total_lunches and
#percent_reduced_price_of_total_lunches columns
usda_monthly <- usda_monthly %>%
 mutate(percent_free_of_total_lunches = gsub('%','', percent_free_of_total_lunches)) %>%
  mutate(percent_reduced_price_of_total_lunches = gsub('%','',percent_reduced_price_of_total_lunches)) %>%
  mutate(month = gsub("-", " ", month))
Last, I make sure the class of each column is correct. All of the columns were of class numeric when read in, so I mutated the month column to yearmon using the zoo package, and everything else to numeric. I also add season and covid status columns to the data frame depending on the date of each observation for future analysis.
#convert month column to class datetime from class character
usda_monthly <- usda_monthly %>%
  mutate("month" = zoo::as.yearmon(month, "%y %b")) %>%
  mutate("covid_status" = ifelse(month > "Feb 2020", "covid", "pre-covid"))

#convert percent free lunches to numeric
usda_monthly <- usda_monthly %>%
  mutate(percent_free_of_total_lunches = as.numeric(percent_free_of_total_lunches))

#add season component
usda_monthly <- usda_monthly %>%
  mutate(month_2 = format(month, "%b")) %>%
  mutate(season = ifelse(month_2 == "Dec" | month_2 == "Jan" | month_2 == "Feb", "winter",
                         ifelse(month_2 == "Mar" | month_2 == "Apr" | month_2 == "May", "spring",
                                ifelse(month_2 == "Jun" | month_2 == "Jul" | month_2 == "Aug", "summer",
                                       ifelse(month_2 == "Sep" | month_2 == "Oct" | month_2 == "Nov", "fall", NA)))))
Finally, to have an initial look at my monthly lunch participation data over time, I make a simple line graph here:
#total lunches served plot
total_lunches_testplot <- ggplot(data = usda_monthly, aes(x = month, y = total_lunches_served)) +
  geom_line(color = "darkcyan") +
  theme_minimal() +
  labs(title = "NSLP Lunches Served (Monthly)",
       x = "Month",
       y = "Total Lunches Served",
       caption = "Figure 1: Monthly meals served nationally by NSLP between October 2017 and August 2021")

total_lunches_testplot
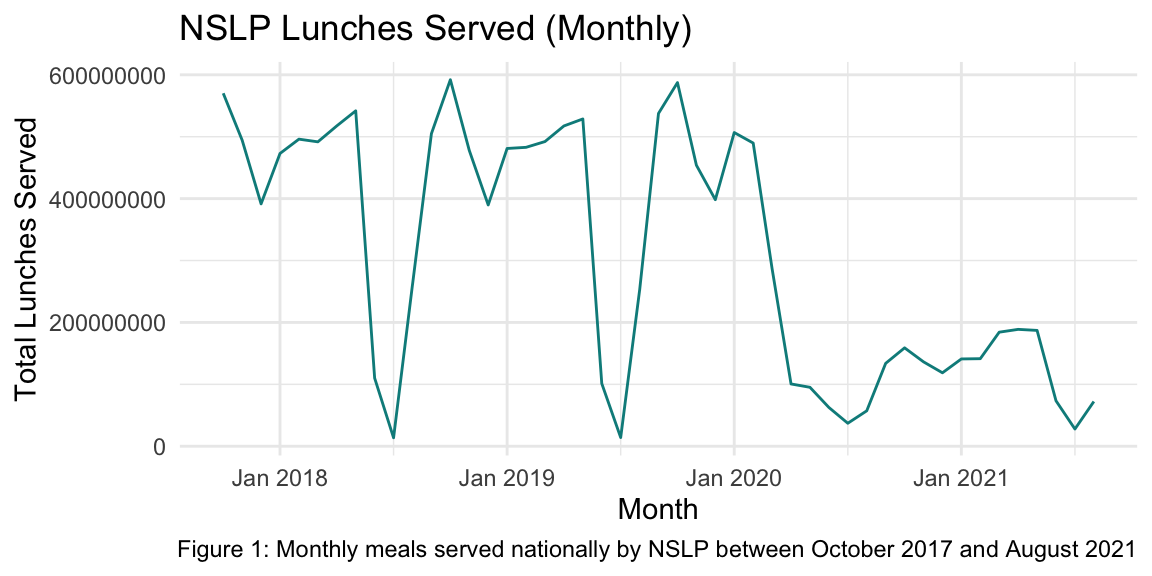
At a first glance, I can see that there are seasonal dips in NSLP lunch participation in the summers, as expected. There also appears to be a dip in participation before January, which I would suspect is due to holiday recesses. It seems that the start of the school year does have higher participation than any of the winter and spring months, though. I plan to investigate this in my analysis.
I can see that participation dropped dramatically when schools closed, which I also plan to investigate in my analysis.
Data Quality
Every school day, school cafeteria staff at participating NSLP schools report meals claimed by students who qualify for free- and reduced-priced lunches. That meets the numbers from this dataset are self-reported by schools and districts nationally. The USDA conducts periodically audits schools to control for accurate serving, counting, and claiming or reimbursable meals.
This analysis assumes that the numbers presented by the USDA are accurate monthly meals served nationally, but there is risk for systematically biased sampling. In my own work, I have observed inaccurate claim reports as a results of short staffing and reduced bandwidth for serving and counting. This may mean that school nutrition programs with lower budgets (i.e. more free-and-reduced eligible students, because of funding models) are at risk for less accurate reporting.
Analysis Plan
Seasonality in NSLP
For the first part of my analysis, I investigate seasonal differences in NSLP participation by decomposing the data seasonal and trend components using the classical_decomposition() function and applying autoplot() to that. The classical decomposition decomposes my data into the following relationship
\(L{t} = S{t} + T{t} + R{t}\)
Where \(L{t}\) is lunches served per month, \(S{t}\) is a seasonal component, \(T{t}\) is the trend component, and \(R{t}\) is the remainder.
To visualize this decomposition, I first create a tsibble with the months as class yearmonth and the total lunches served per month, then create an additive classical decomposition model. I then use this model to generate an autoplot which helps to visualize the presence of seasonality and long-term trends in the data for both groups. Finally, I generate an autocorrelation function with a lag of 12 because I want to see how much participation in one month is correlated with participation for the rest of the school year.
#confusingly, converting the data I want in my time series requires data of class `yearmonth` not `yearmon` I learned I can use `yearmonth()` from the tsibble package to make a tsibble with the correct time class
usda_monthly <- usda_monthly %>%
  mutate(month = yearmonth(month))

monthly_tsib <- usda_monthly %>%
  select(c(month, total_lunches_served)) %>%
  as_tsibble()
total_decomp = monthly_tsib %>%
  model(
    classical_decomposition(total_lunches_served, type = "additive")
  ) %>%
  components()

total_auto <- autoplot(total_decomp) +
  labs(title = "Classical Additive Decomposition of Monthly Meals Served Nationally by NSLP",
       caption = "Figure 3: Seasonality component has a larger impact of meals served than long term trends. ")
Impact of Covid on NSLP
In addition to considering the trend component of the classical decomposition from March 2020 onward, I also complete a hypothesis test to compare the mean monthly participation in the NSLP before and during the Covid-19 pandemic.
Mean monthly participation in the NSLP prior to Covid-19 was 419605973 and mean monthly participation in the NSLP during the Covid-19 pandemic is 122430863.
My null hypothesis is that there is no significant difference between the pre- and during- Covid-19 lunches served, and my alternative hypothesis is that there is a significant difference between the conditions. I test the null hypothesis using a Welch’s two-sample t test.
Summarize results visually and in words
Seasonality of NSLP
jpeg(file = "total_acf.jpeg")
plot(total_acf, main = "Serial Correlation of National Monthly NSLP Participation")
dev.off()
quartz_off_screen
                2
The results of the autocorrelation function (ACF) indicate that monthly participation in the NSLP for this month is positively correlated with monthly participation in the NSLP for the next two months, and the prior two months with statistical significance. Participation in all of the other months of the year have a positive correlation with the present month, but not of any statistical significance from correlation of 0, as indicated by the blue line indicating 95% confidence interval.
I wondered if isolating participation data to only students who qualify for free lunch might change the ACF output, since I would expect more reliance on NSLP for nutrition in this population, but the ACF plot was about the same, which was interesting.
I interpret the lack of correlation among other months as evidence that there could be more efforts to make sure students have regular access to school meals.
total_auto
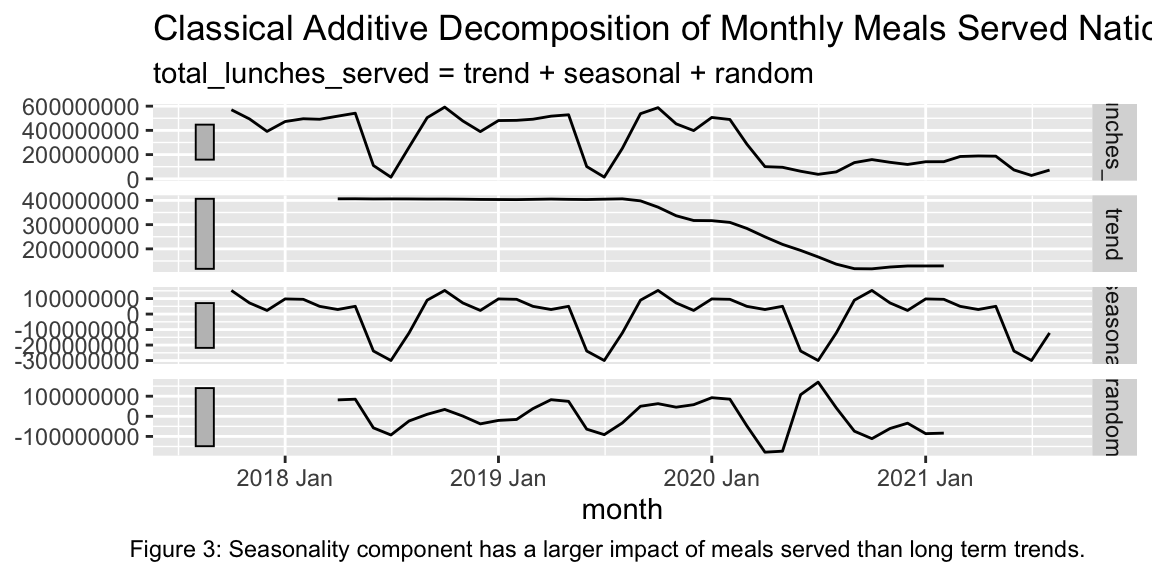
The results of my decomposition function autoplot demonstrate a stronger seasonal effect in NSLP participation among all participating students. We can see declines in participation during the summer months, as we would expect but also changes in participation during the school year. I predict that because the data is reported as a monthly total, that there are seasonal decreases in participation during months with school breaks (in winter and spring). Because of this and the domination of the summer impact to seasonality, there is not sufficient evidence enough to say that the NSLP participating schools and districts feed students differently seasonally during the school year.
Any seasonal differences between school months were drowned out by the seasonal differences between school months and summer months. To further investigate the seasonal differences in meals served, I tried to also run hypothesis tests comparing total meals served for fall and spring months, fall and winter months, and spring and winter months, with null hypotheses that there is no difference in mean student fed between any particular season and the rest of the year.
#t test: null hypothesis that mean difference between fall and the rest of the school year is zero
tidy(t.test(usda_monthly$total_lunches_served[usda_monthly$season == "fall"], usda_monthly$total_lunches_served[usda_monthly$season != "fall" | usda_monthly$season != "summer"]))
# A tibble: 1 × 10
    estimate  estimate1 estimate2 statistic p.value parameter conf.low
       <dbl>      <dbl>     <dbl>     <dbl>   <dbl>     <dbl>    <dbl>
1 116728134. 422522363.    3.06e8      1.86  0.0820      15.9  -1.66e7
# … with 3 more variables: conf.high <dbl>, method <chr>,
#   alternative <chr>
#t test: null hypothesis that mean difference between winter and the rest of the school year is zero
tidy(t.test(usda_monthly$total_lunches_served[usda_monthly$season == "winter"], usda_monthly$total_lunches_served[usda_monthly$season != "winter" | usda_monthly$season != "summer"]))
# A tibble: 1 × 10
   estimate  estimate1  estimate2 statistic p.value parameter conf.low
      <dbl>      <dbl>      <dbl>     <dbl>   <dbl>     <dbl>    <dbl>
1 70046711. 375840940. 305794229.      1.33   0.197      21.8  -3.91e7
# … with 3 more variables: conf.high <dbl>, method <chr>,
#   alternative <chr>
#t test: null hypothesis that mean difference between spring and the rest of the school year is zero
tidy(t.test(usda_monthly$total_lunches_served[usda_monthly$season == "spring"], usda_monthly$total_lunches_served[usda_monthly$season != "spring" | usda_monthly$season != "summer"]))
# A tibble: 1 × 10
   estimate  estimate1  estimate2 statistic p.value parameter conf.low
      <dbl>      <dbl>      <dbl>     <dbl>   <dbl>     <dbl>    <dbl>
1 38540202. 344334430. 305794229.     0.634   0.534      18.1  -8.91e7
# … with 3 more variables: conf.high <dbl>, method <chr>,
#   alternative <chr>
I show no significant differences in mean number of students fed between school year seasons. I would be curious to run this test if more data were available, as when summer data is excluded, there are only 35 observations in the sample, on the cusp of violating the Central Limit Theorem. With the data I have here, I cannot answer the question “does the the USDA NSLP show seasonality in feeding kids?” for seasons when school is in session.
Impact of Covid on NSLP
The decomposition model used to understand seasonal trends in NSLP participation also indicated a strong downward trend in 2020 and 2021, which seems obviously related to school closures. As a gut check, I conducted a hypothesis test to compare the mean monthly participation in NSLP before and during the pandemic. I was not sure how to define the dates of the pandemic besides the start of nationwide lockdowns in March 2020. I considered it ongoing, since the continuing spread of the Covid-19 virus, lag in access to vaccines in students relative to adults, rules around attendance for students with symptoms or risk of interaction with infected individuals, and decisions by parents to remove students from schools are all ongoing barriers to institutions which facilitate NSLP meals. Therefore, all months including and after March 2020 are classified as “covid” in my data, and otherwise “pre-covid.”
covid_ttest <- t.test(total_lunches_served ~ covid_status, data = usda_monthly)

covid_pval <- round(covid_ttest$p.value, 11)
covid_tscore <- round(covid_ttest$statistic, 2)
covid_upper_ci <- round(covid_ttest$conf.int[[1]], 2)
covid_lower_ci <- round(covid_ttest$conf.int[[2]], 2)

TTest_Component <- c("P Value", "T Score", "Confidence Interval Lower", "Confidence Interval Upper")
Results <- c(covid_pval, covid_tscore, covid_upper_ci, covid_lower_ci)
covid_df <- data.frame(TTest_Component, Results)

covid_df %>%
  gt() %>%
  tab_footnote(
    footnote = "Figure 4: Hypthesis test statistics for comparing mean students fed monthly before and during Covid.",
    locations = cells_column_labels(
      columns = vars(Results)
    )
  )
| TTest_Component | Results1 |
|---|---|
| P Value | 0.00000000014 |
| T Score | -8.60000000000 |
| Confidence Interval Lower | -367060915.12000000477 |
| Confidence Interval Upper | -227289304.41999998689 |
|
1
Figure 4: Hypthesis test statistics for comparing mean students fed monthly before and during Covid.
|
|
A Welch two-sample t test comparing the means of of monthly meals served before and during the pandemic had statistically significant results with a p value of 0. This means there is a mean nonzero difference between the number of kids NSLP served before and during the pandemic and there is a less than 1 percent probability of observing a difference as extreme as this if the null (0 difference) were true. The confidence interval indicates that with 95% confidence we can estimate the range -227289304.42 - -367060915.12 contains the difference in mean participation from before and during the pandemic. This is important because not only do we confirm what we imagined was true about lack of access to meals, but NSLP fed fewer children meals at a magnitude of hundreds of thousands of meals.
Next steps and future directions
The USDA’s data platform only allows me to access NSLP participation data from 2017 onward. As a next step, it may be useful reach out to their data services to try to obtain data from previous years. 47 months of data are a small sample when we exclude summer data, but I wonder if a larger sample size might be better for illuminating conclusive differences in the mean monthly number of students served between school months by season, which there is no current research about.
Student access to NSLP is vital for supporting equity in U.S. K-12 schools and helping students to be their best, healthiest selves. Understanding gaps in feeding kids - from regular dips to national emergency program closures - can help policy-makers and on-the-ground stakeholders to make data-informed decisions that reduce identified gaps in access to school meals. Enhancing NSLP’s meals served supports millions of hungry students and their families (5). I hope that others continue to make use of the USDA’s publicly available national school meal data to continue to improve the ways we understand USDA program operations in schools.
References
- https://www.ers.usda.gov/topics/food-nutrition-assistance/child-nutrition-programs/national-school-lunch-program/
- https://fns-prod.azureedge.net/sites/default/files/resource-files/NSLPFactSheet.pdf
- http://bestpractices.nokidhungry.org/sites/default/files/2020-06/Need%20for%20School%20Nutrition%20Budget%20Relief.pdf
- https://www.karger.com/Article/Pdf/66399
- https://www.ers.usda.gov/webdocs/publications/102076/err-298.pdf?v=3840.6